2. Read TESEO’s forcing files
![]()
2.1. Install pyTESEO
If you are running this notebook from
Google colabuncomment and run!pip install pyteseo && pyteseo-testsin the cell below. Doing this you will installpyteseofrompypirepository and runpyteseo-teststo check the installation (all tests have to succeed).If you are using this notebook in your own local machine you need to install the library from the local repo
pip install .or pypipip install pyteseo.
# !pip install pyteseo && pyteseo-tests
2.2. Read TESEO’s forcings files (currents and winds) and plot them.
import warnings

warnings.simplefilter(action="ignore")
Define Paths
from pathlib import Path
import pyteseo.tests as tests_

data_path = Path(tests_.__file__).parent / "data"
lstcurr_path = data_path / "lstcurr.pre"
lstwinds_path = data_path / "lstwinds.pre"
Read bathymetry and coastline from TESEO’s format files
from pyteseo.io.forcings import read_forcing

currents_df = read_forcing(lstcurr_path, forcing_type="currents")
winds_df = read_forcing(lstwinds_path, forcing_type="winds")
winds_df.head(5)
| time | lon | lat | u | v | |
|---|---|---|---|---|---|
| 0 | 0.0 | 9.618706 | 43.98785 | -3.765736 | 0.509148 |
| 1 | 0.0 | 9.618706 | 44.11285 | -3.765736 | 0.509148 |
| 2 | 0.0 | 9.618706 | 44.23785 | -3.765736 | 0.509148 |
| 3 | 0.0 | 9.743706 | 43.98785 | -3.765736 | 0.509148 |
| 4 | 0.0 | 9.743706 | 44.11285 | -3.765736 | 0.509148 |
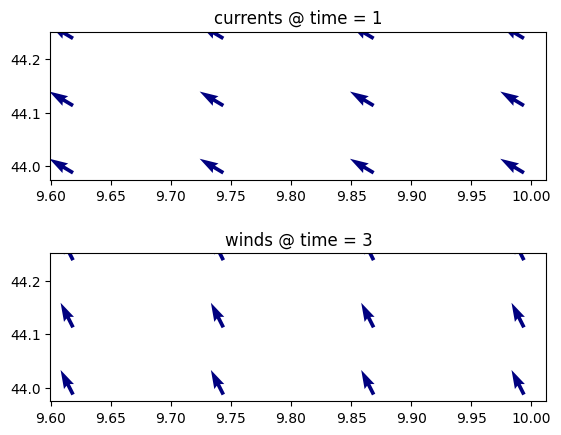
Plot velocity fields
from matplotlib import pyplot as plt
import numpy as np


currents_df["mod"] = np.sqrt(currents_df.u**2 + currents_df.v**2)
winds_df["mod"] = np.sqrt(winds_df.u**2 + winds_df.v**2)

currents_time = 1
currents = currents_df.loc[currents_df["time"] == currents_time]

winds_time = 3
winds = winds_df.loc[winds_df["time"] == winds_time]

fig = plt.figure()
ax1 = fig.add_subplot(211)
plt.title(f"currents @ time = {currents_time}")
q1 = ax1.quiver(
    currents["lon"],
    currents["lat"],
    currents["u"],
    currents["v"],
    currents["mod"],
    cmap="jet",
)

time = 3
ax2 = fig.add_subplot(212)
plt.title(f"winds @ time = {winds_time}")
q2 = ax2.quiver(
    winds["lon"],
    winds["lat"],
    winds["u"],
    winds["v"],
    winds["mod"],
    cmap="jet",
)

plt.subplots_adjust(hspace=0.5)