1. Read TESEO’s domain files
![]()
1.1. Install pyTESEO
If you are running this notebook from
Google colabuncomment and run!pip install pyteseo && pyteseo-testsin the cell below. Doing this you will installpyteseofrompypirepository and runpyteseo-teststo check the installation (all tests have to succeed).If you are using this notebook in your own local machine you need to install the library from the local repo
pip install .or pypipip install pyteseo.
# !pip install pyteseo && pyteseo-tests
import warnings
warnings.simplefilter(action="ignore")
1.1.1. Load TESEO domain
Teseo domain is composed by 2 files: grid.dat and costa.dat.
These files has to be located in the same folder.
You only need to instance the class Domain() from pyteseo.models.domain passing the path to the folder where de domain files are located
from pathlib import Path
from pyteseo.models.domain import Domain

# path where example data needed by the use case is located
import pyteseo.tests as tests_
domain_path = Path(tests_.__file__).parent / "data/ibiza_domain"

domain = Domain(path = str(domain_path))
domain
Domain(path='/home/runner/.local/lib/python3.12/site-packages/pyteseo/tests/data/ibiza_domain', grid=Grid(path='/home/runner/.local/lib/python3.12/site-packages/pyteseo/tests/data/ibiza_domain/grid.dat', dx=0.016666, dy=0.016667, nx=62, ny=50, bbox=(0.891666667, 38.4916667, 1.90833333, 39.3083333), nan_value=-999), coastline=Coastline(path='/home/runner/.local/lib/python3.12/site-packages/pyteseo/tests/data/ibiza_domain/costa.dat', bbox=(1.1587, 38.6412, 1.6504, 39.1196), n_polygons=36), bbox=(0.891666667, 38.4916667, 1.90833333, 39.3083333))
Domain class read grid file and coastline files (if exists) and stores the main properties of the both in grid and coastline fields, plus the rest of general properties, like:
path: path to the folder where the domain is located
bbox: bounding box of the domain (should be the same than the bbox of the grid file)
grid: grid object
coastline: coastline object
print(f"path: {domain.path}\nbbox : {domain.bbox}\ngrid: {domain.grid}\ncoastline: {domain.coastline}\n")
path: /home/runner/.local/lib/python3.12/site-packages/pyteseo/tests/data/ibiza_domain
bbox : (0.891666667, 38.4916667, 1.90833333, 39.3083333)
grid: path='/home/runner/.local/lib/python3.12/site-packages/pyteseo/tests/data/ibiza_domain/grid.dat' dx=0.016666 dy=0.016667 nx=62 ny=50 bbox=(0.891666667, 38.4916667, 1.90833333, 39.3083333) nan_value=-999
coastline: path='/home/runner/.local/lib/python3.12/site-packages/pyteseo/tests/data/ibiza_domain/costa.dat' bbox=(1.1587, 38.6412, 1.6504, 39.1196) n_polygons=36
in domain.grid and domain.coastline other objects are instanciated, storing especifical propierties for each component, like:
Grid
path
bbox
dx, dy, nx, ny
nan_value
Coastline
path
bbox
n_polygons
print(f"Number of grid cells in longitude axis equals {domain.grid.nx}, and the number of polygons in the coastline is {domain.coastline.n_polygons}")
Number of grid cells in longitude axis equals 62, and the number of polygons in the coastline is 36
Also each object has implemented a .plot() method to provide a standard representation:
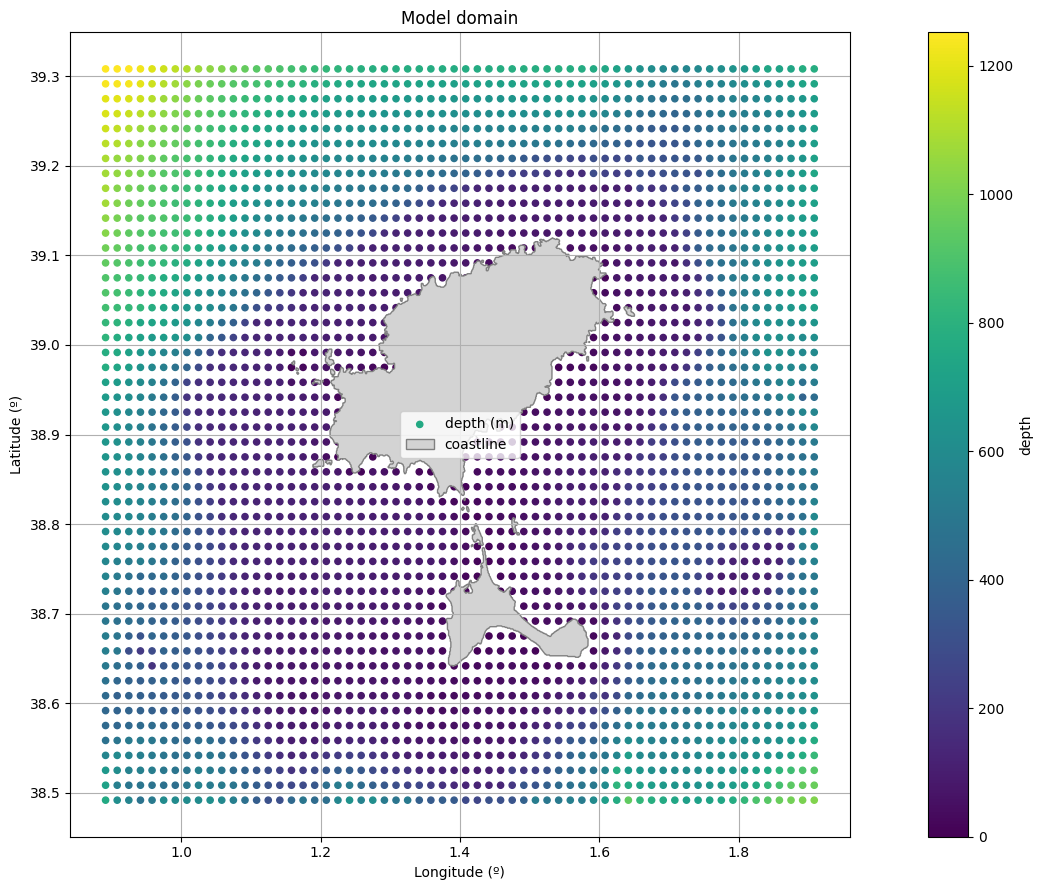
domain.plot()
domain.grid.plot()
domain.coastline.plot()
domain.plot()
Finally, access to data by means of pandas, geopandas or xarray libraries and datamodel (dataframe, geodataframe or dataset) can be obtained by means of the following methods:
.load_df()
.load_gdf()
.load_ds()
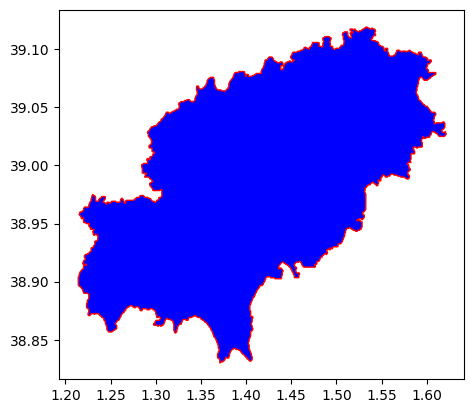
gdf = domain.coastline.load_gdf()
gdf.loc[[0]].plot(color="blue", edgecolor="red")
<Axes: >
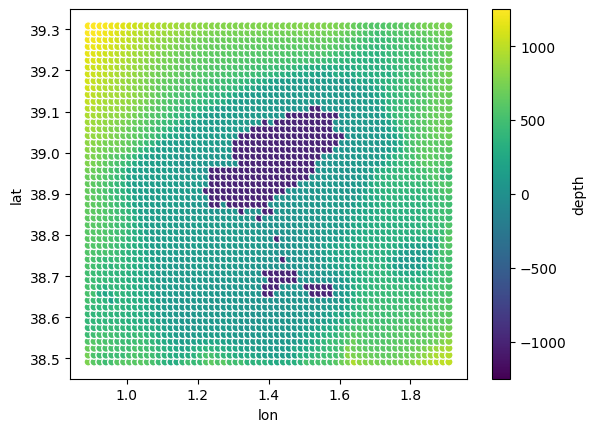
df = domain.grid.load_df()
df.plot.scatter(x="lon", y="lat", c="depth", cmap="viridis")
<Axes: xlabel='lon', ylabel='lat'>
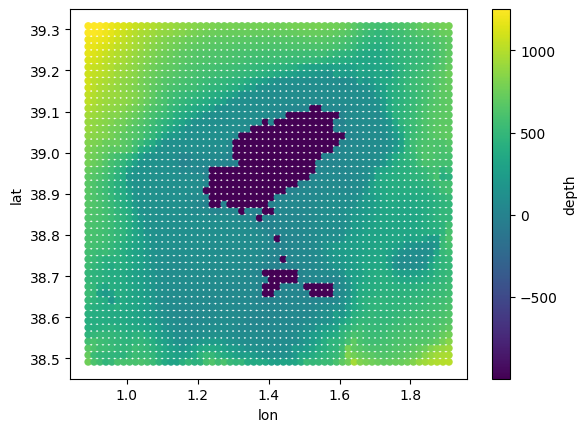
ds = domain.grid.load_ds()
ds.plot.scatter(x="lon", y="lat", hue="depth", cmap="viridis")
<matplotlib.collections.PathCollection at 0x7faba293cb60>