SOSeas - Assessment Tool for Predicting the Dynamic Risk of Drowning on Beaches
🏖️🛟🚩 #electronic-flag #drowning #metocean #beach-safety #neuronal-network #deep-learning
Context
Despite significant advances in science, technology, and coastal management, drowning remains a leading cause of accidental death on beaches. In Latin America, Brazil presents one of the highest drowning indices — with one drowning every 91 minutes. Against this backdrop, the following question arises:
Can we develop a global operational system to inform beachgoers and managers of drowning risks on both patrolled and unpatrolled beaches?
 {fig-align=”center”}
Description
SOSeas is a cutting-edge application developed to predict and reduce drowning risk while improving the dissemination of relevant information for beach users, lifeguards, and managers.
Its main innovation is the electronic bathing flag, which reflects the dynamically predicted drowning risk at any given beach.
Key Features
Cross-analysis of metocean conditions, beach morphology, and historical flag event data.
Use of deep learning techniques (Deep Neural Networks) to predict drowning risk based on real-time environmental data.
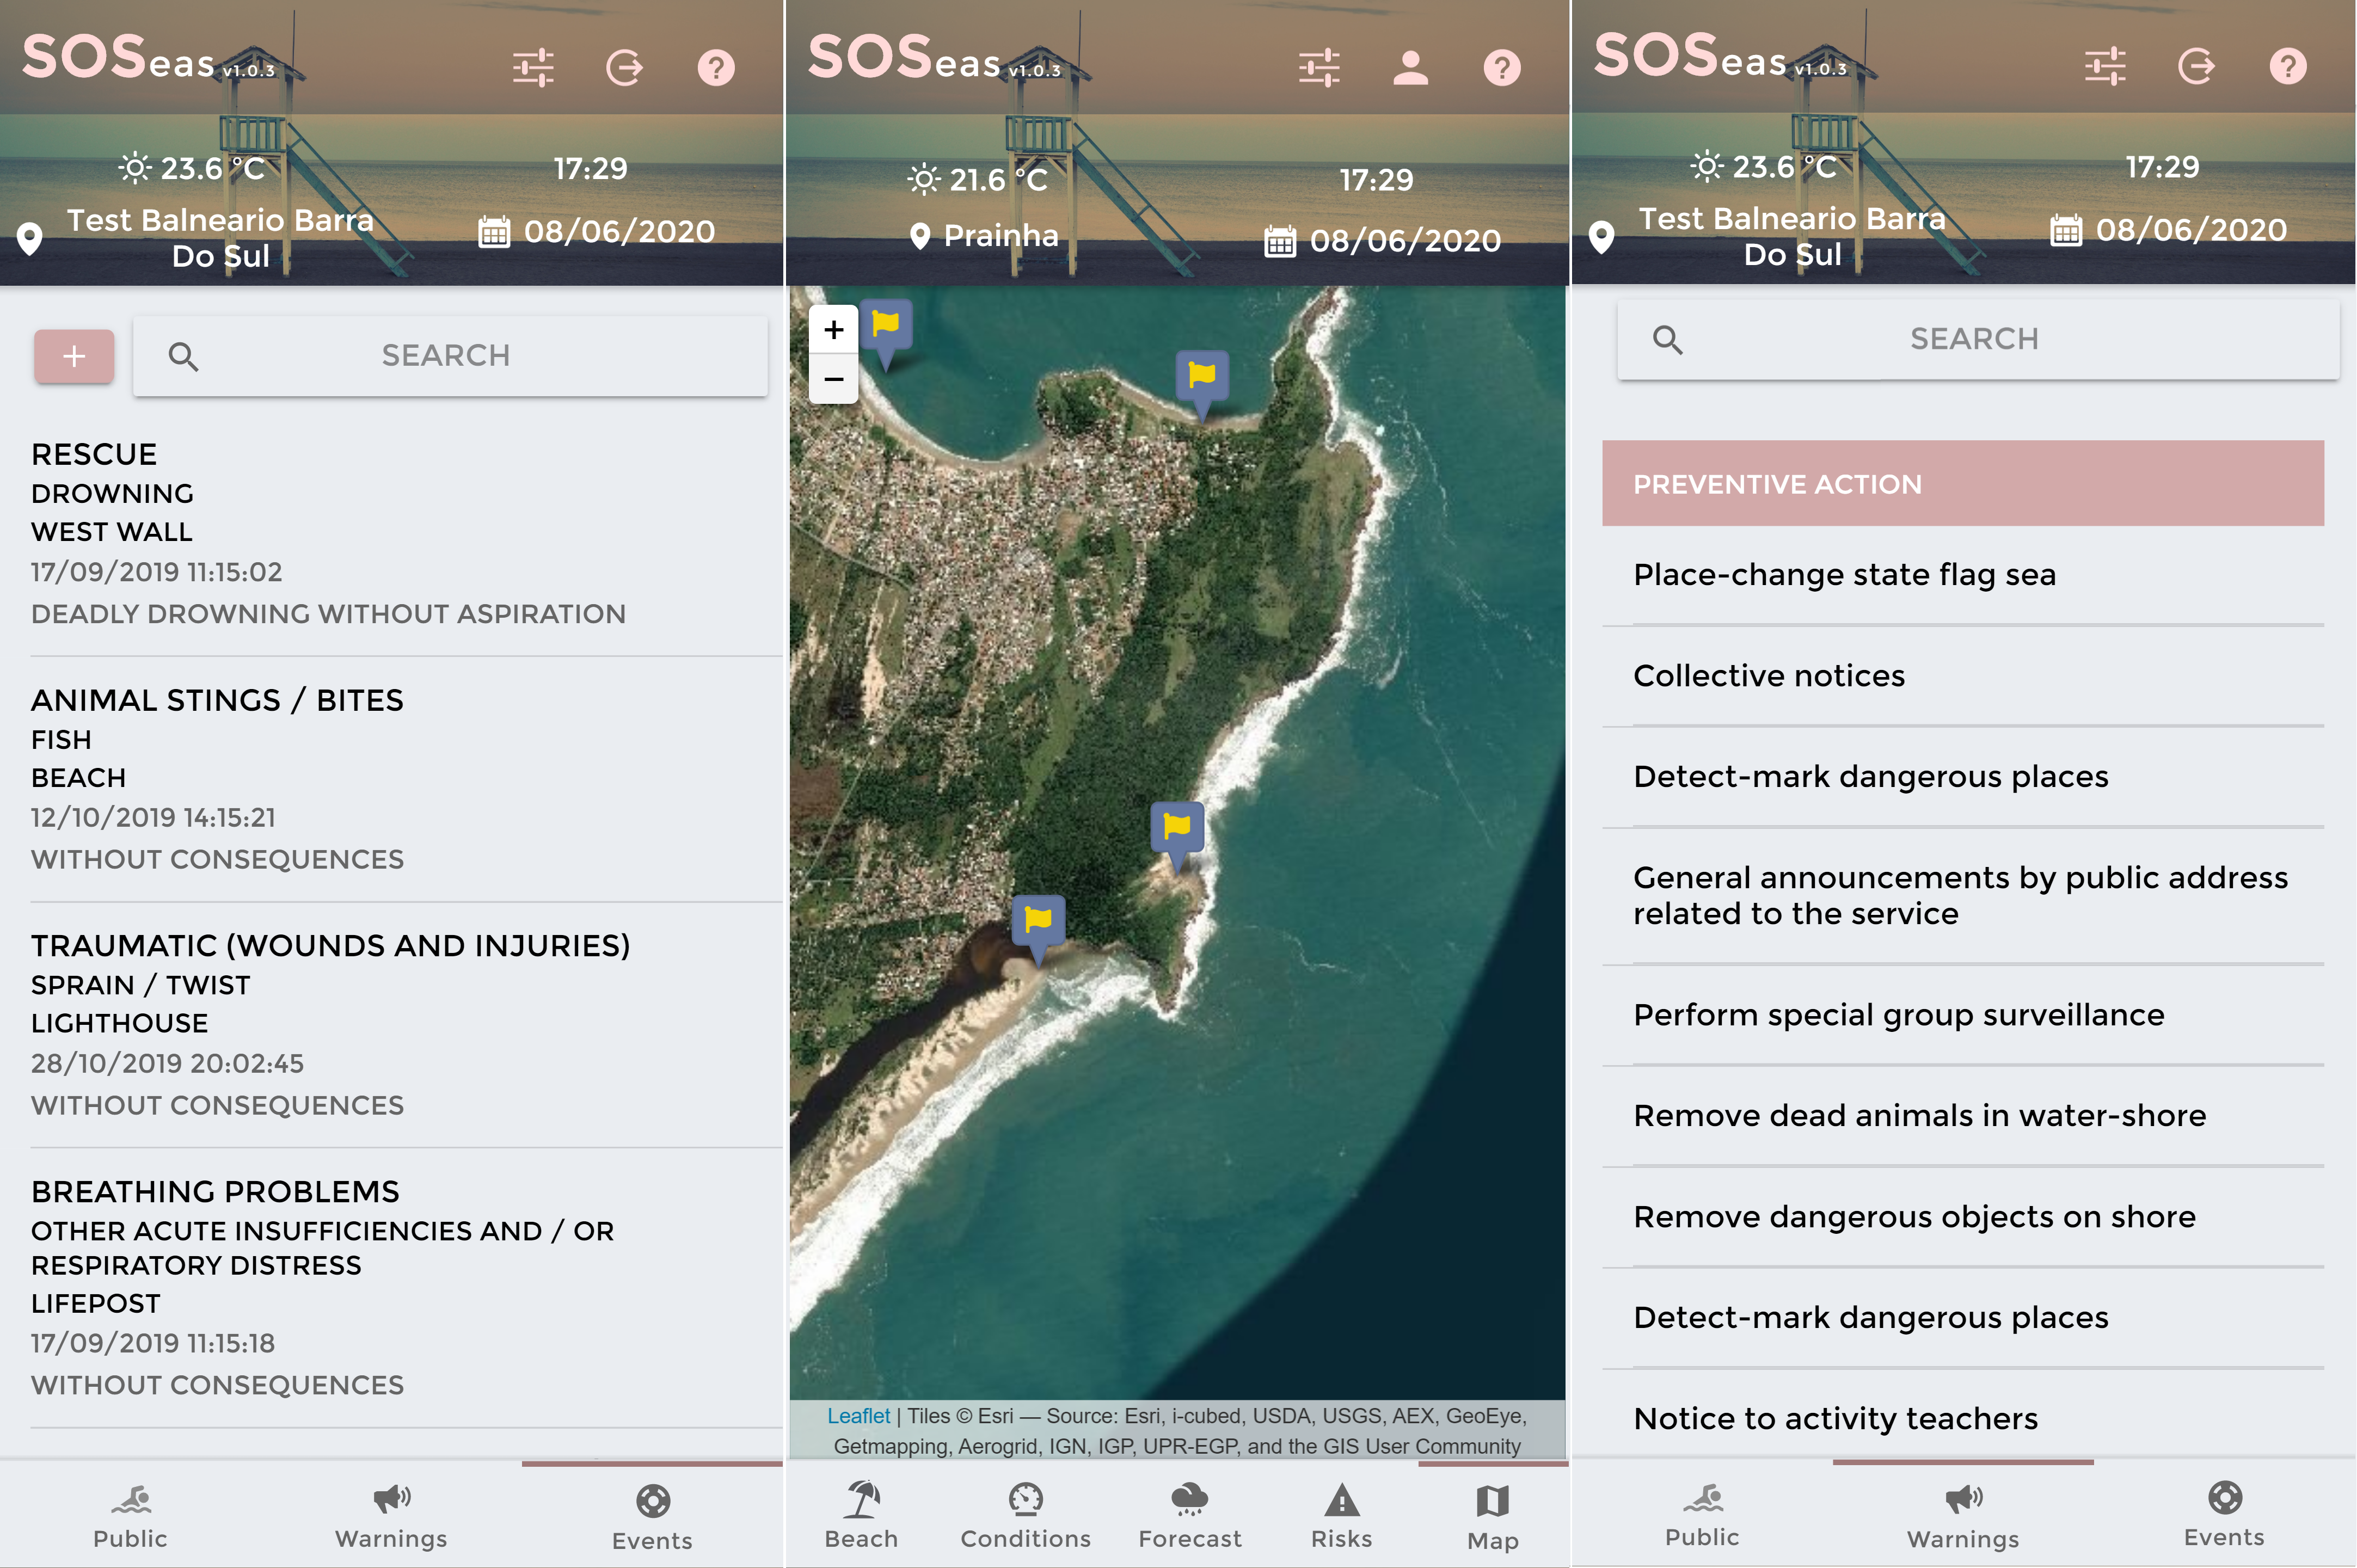
Electronic flag system to communicate risk levels to the public.
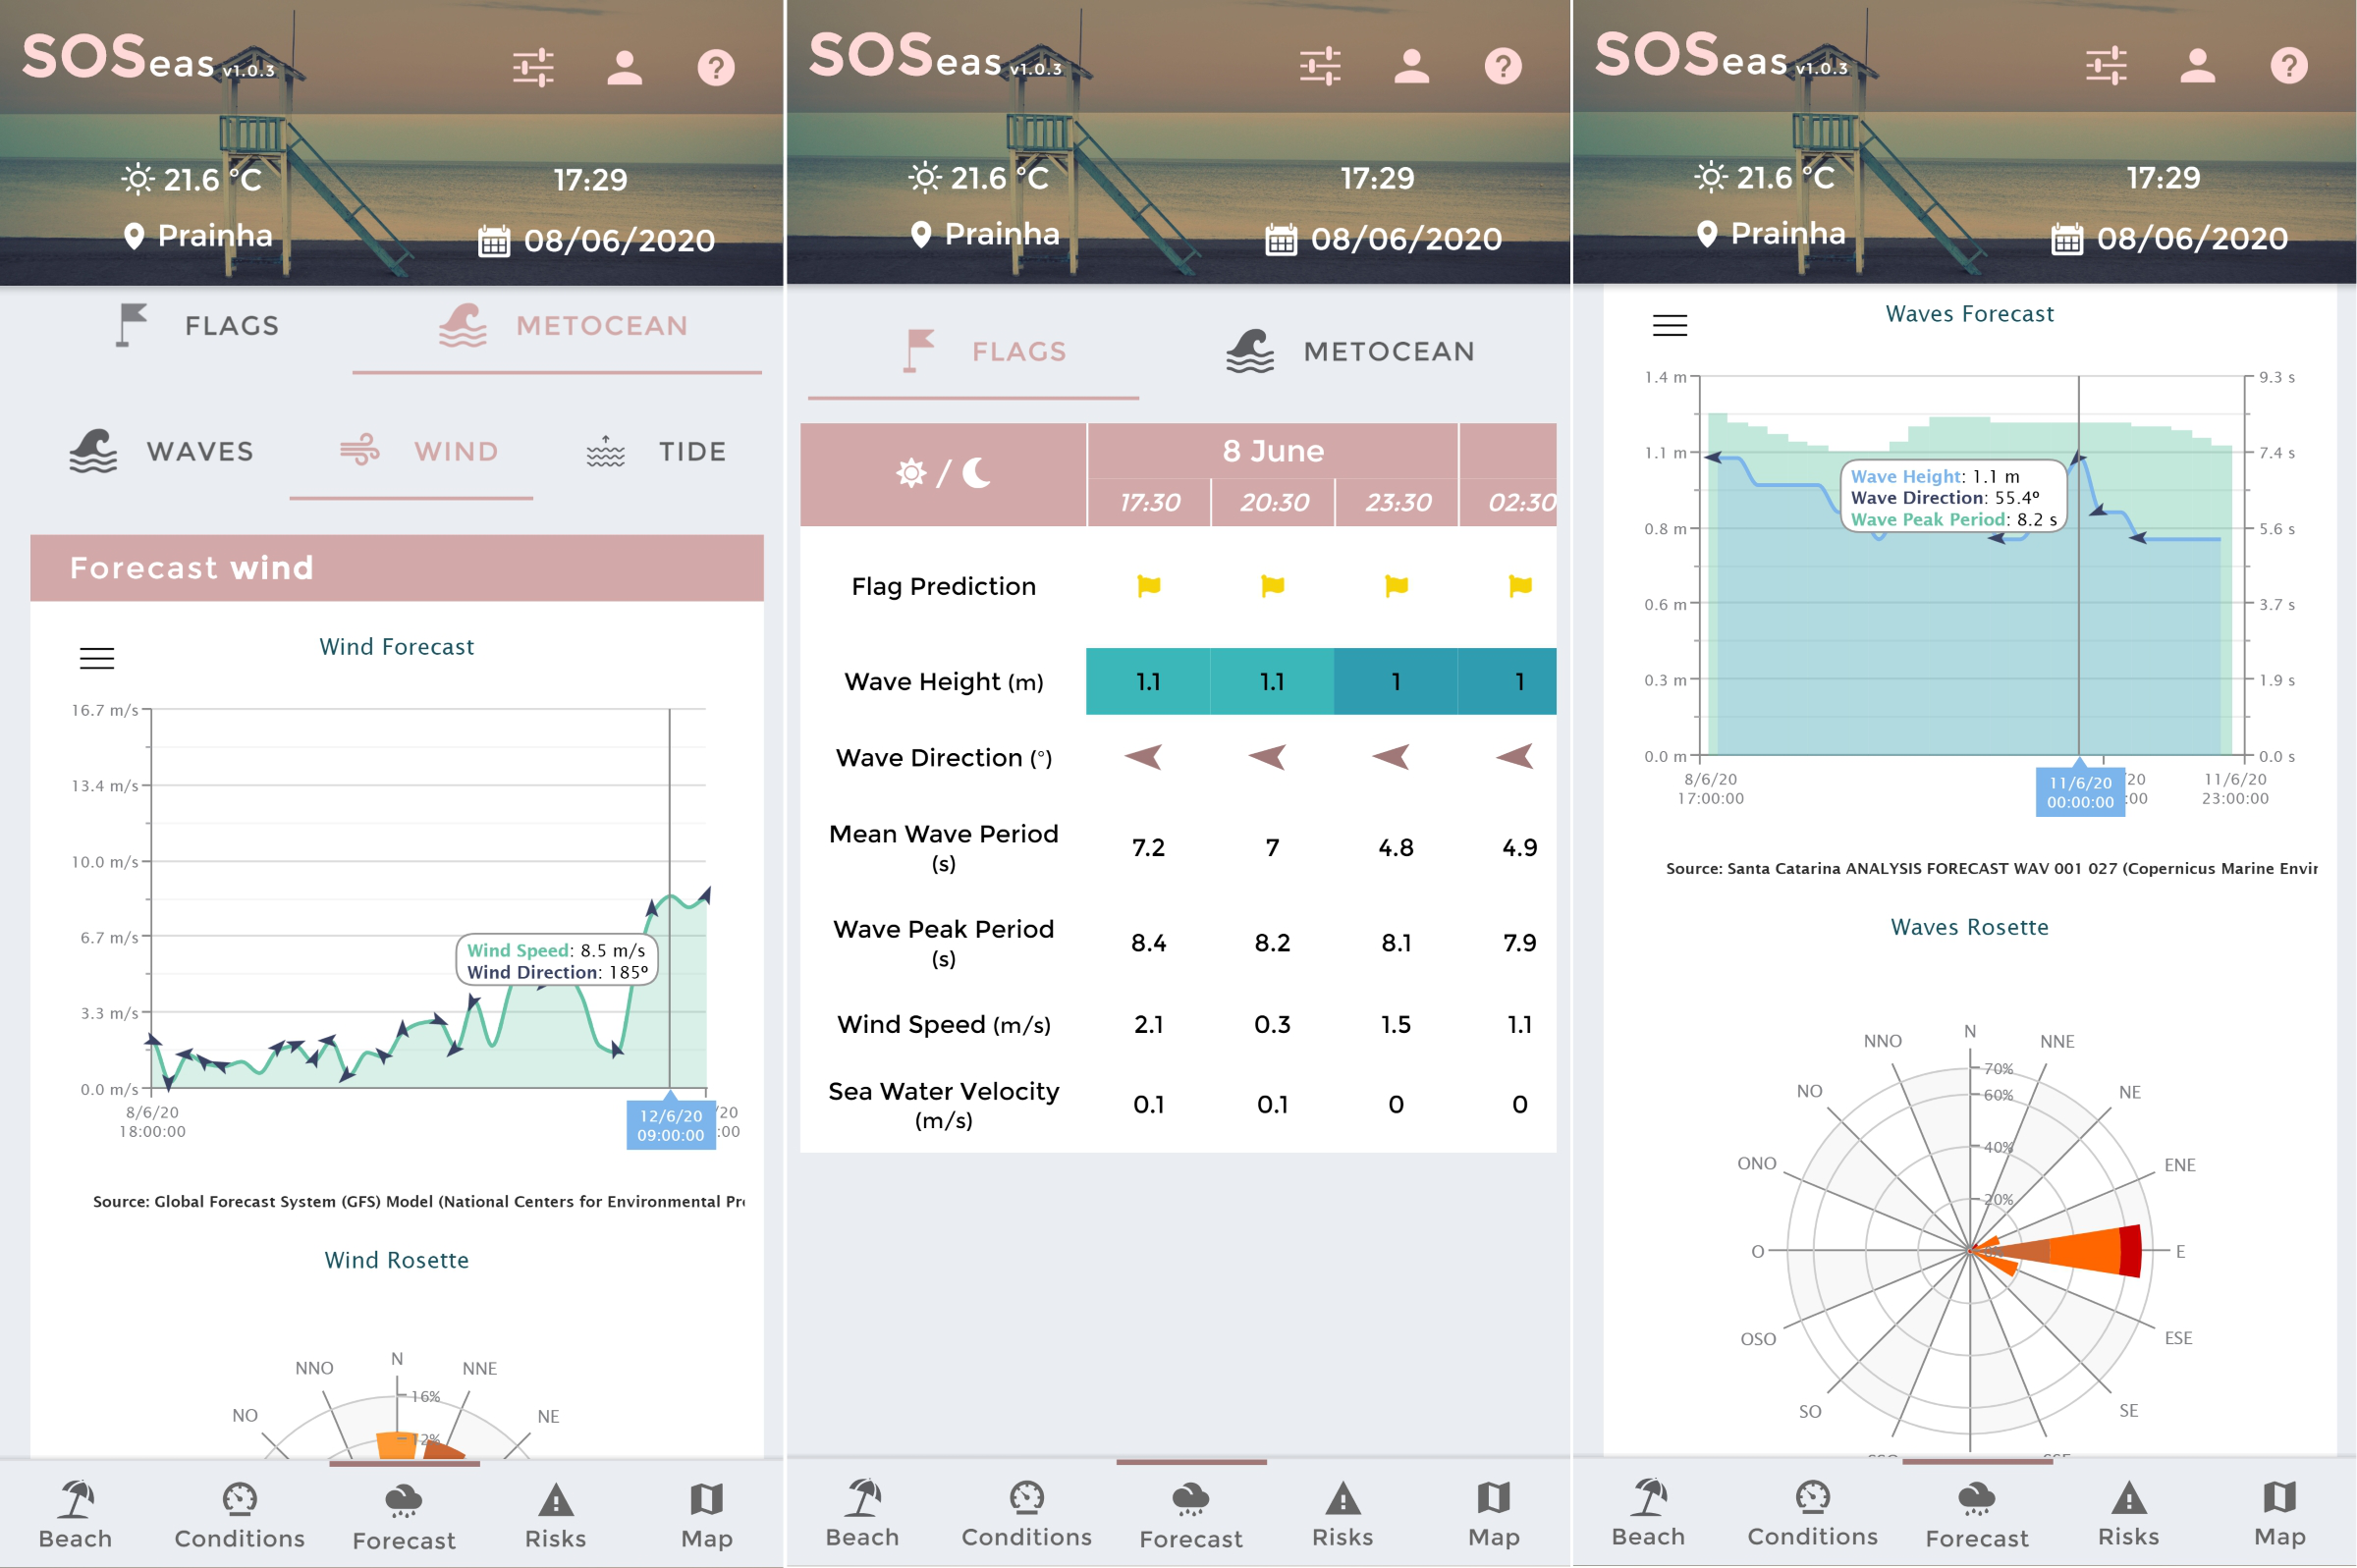
User-centric interface including:
Forecast of winds, waves, currents, and tides.
Maps of beach characteristics and services.
Warnings for hazards such as jellyfish or harmful algal blooms.
 {fig-align=”center”}
Insights
🛟 Enhanced Safety: Lifeguards, managers, and beachgoers receive predictive, dynamic risk information to improve situational awareness.
🌊 Proactive Management: Forecasting allows better planning, prevention strategies, and more efficient beach safety resource allocation.
Other Remarks
📄 Scientific Publication: doi:10.5194/egusphere-egu2020-18033
🌏 International Implementation: A version of the tool was also deployed in Australia (reference pending).
💰 Funding: Project funded by CMEMS DEMONSTRATION COASTAL-GLOBAL OCEAN
(Contract: 110-DEM5-L10)
 {width=”150” style=”float: right;”}
 {width=”500px” fig-align=”center”}